CDI developed a wealth of test data, project experience, and analytical skills over 30 years. Our areas of expertise in conveyor belt analysis and testing are listed below. These technologies are used in design to achieve optimal design, to find the root cause of the failure and also to assist in improvements to existing systems.
Belt splice test and analysis
CDI performs the design, analysis, testing and inspection of joints. During the splice inspection, the rubber cover is carefully removed to expose the underlying steel cables. The straightness and design of the steel cables are verified against the splice specification. We study if there are gaps in the rubber between the steel cables, if there is rubber that loses adhesion in the steel cables and we tried to determine the locations of the failure starting point and its propagation path.
We can test fabric and steel belt splice samples to measure static strength and dynamic fatigue strength on a tensile testing machine.
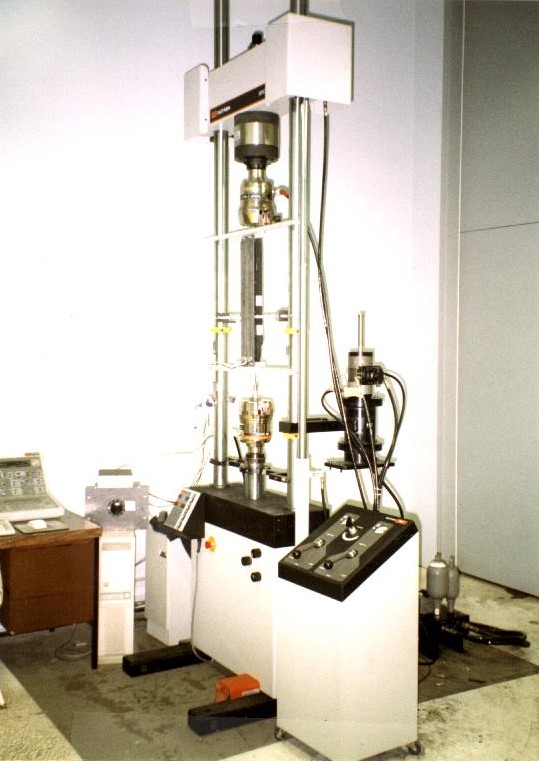
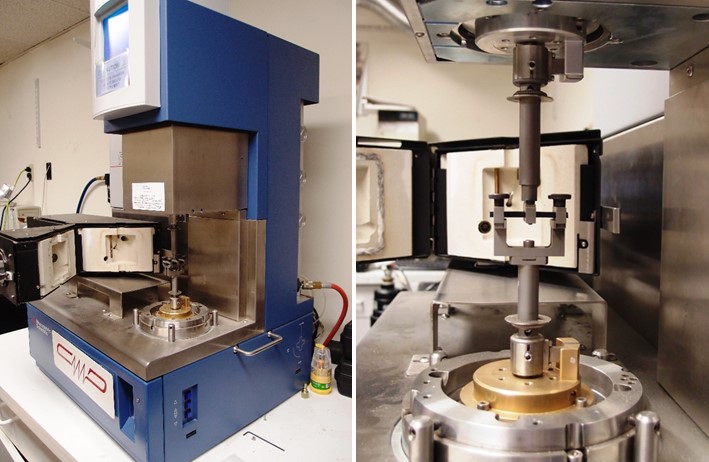
The dynamic splice fatigue test can verify the splice design and splice material of the high-strength conveyor belt above ST-4000. The strap is looped and spliced at the factory for testing. The testing machine has two pulleys placed on a large steel frame. A pulley is powered by an electric motor to rotate the belt; the other pulley is connected to two parallel hydraulic cylinders to move back and forth to create tension load cycles on the belt loop. In 1997, CDI designed and built a dynamic splice fatigue machine that can test the ST-10000 splice. In 2017 CDI designed a new dynamic splicing fatigue machine that can test the ST-15000 splice, at a maximum distance of 12m between the center of two pulleys. The project is a collaboration with Double Arrow Rubber Co., Ltd., where the testing machine is also located. The test methodology complies with the DIN 22110-3 standard.
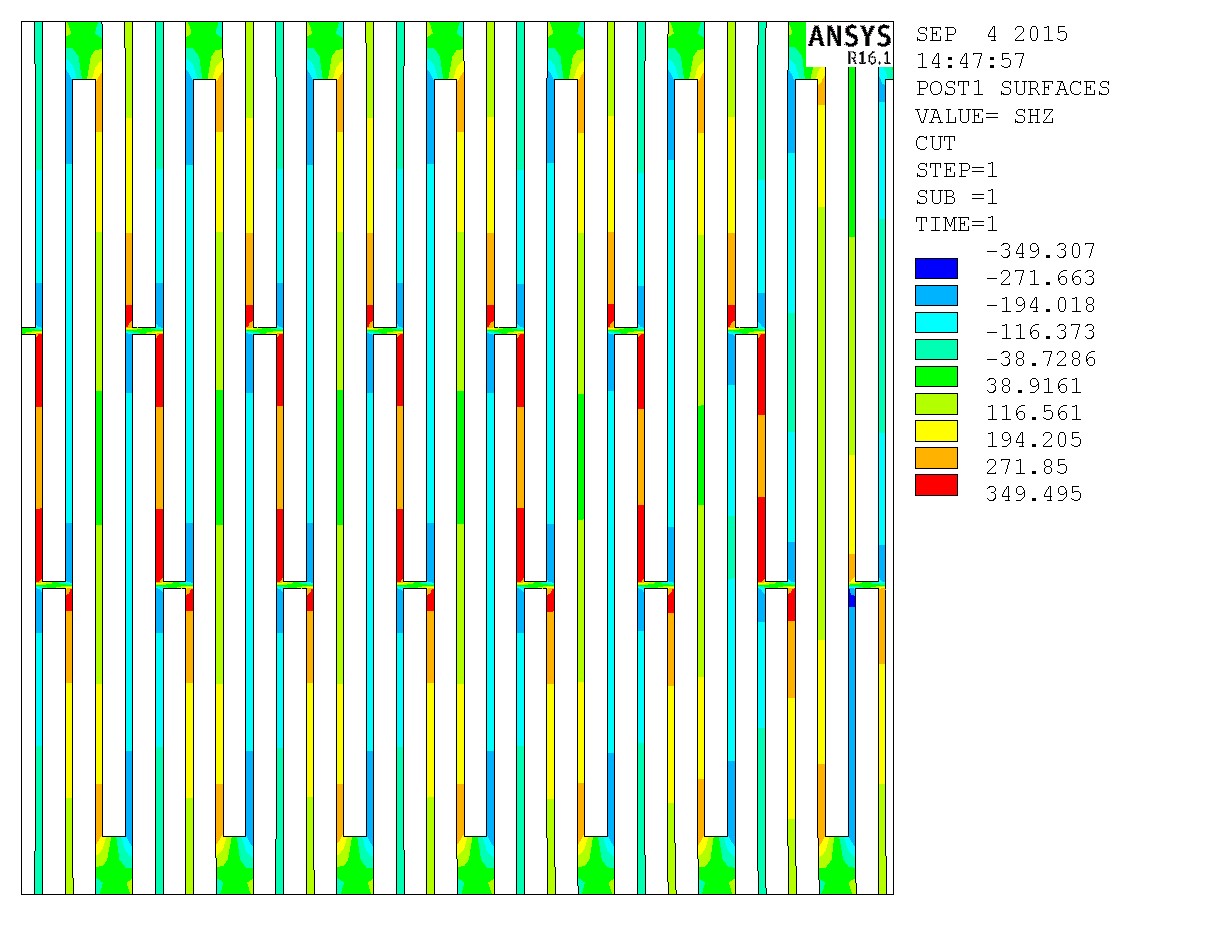
CDI developed a finite element analysis program to analyze the shear stress of rubber at the joint. In the figure below, the red and blue areas (positive and negative values) show the shear stress of rubber in two different cutting directions between the steel cables (white columns), in a 3-step splice. This program is used to optimize splice designs by changing the rubber spacing, rung length, and splice pattern to minimize cutting effort. It is also used in the analysis of belt splice failures to investigate the level of shear stress.
Rubber Properties Tests
Where does the energy loss in conveyors come from? Research and measurement in the field have shown that the rolling resistance indentation (IRR) between the belt and the rollers can represent ~ 60% of the total energy loss (excluding the effect of gravity). Reducing IRR is an effective way to reduce conveyor power consumption and belt tension. The IRR is due to the hysteresis loss of energy of the viscoelastic deformation in the lower cover of the belt, this factor is closely related to the properties of the lower cover of the belt. The low rolling resistance belt has a modified rubber cover with less hysteresis energy loss, which can reduce the energy demand of the conveyor by 10% to 40% compared to the conventional belt. The LRR conveyor belt is also named as energy optimized belt or energy saving belt by different manufacturers.
CDI is a pioneer in using the LRR belt to optimize conveyor design with reduced capital and operating costs. We first applied this technology in 1989 on the 20 km Channar overland conveyor in Australia, and our latest applications are on the 27 km Impumelelo overland system in South Africa and the 15 km Yubei tubular conveyor in China.
A key question is the measurement of the IRR property of a particular rubber. CDI uses the Rheometrics RSA3 Dynamic Mechanical Analyzer (DMA) to measure the viscoelastic properties E ‘(elastic modulus) and E “(loss modulus) of a rubber sample over a wide range of temperature, stress and frequency. The data acquired DMA tests are processed using a special program to generate master curves and then incorporated into Beltstat software for conveyor calculations This technology has been developed since 1989, applying it to conveyor design and accumulating verification data.
Standard Belts
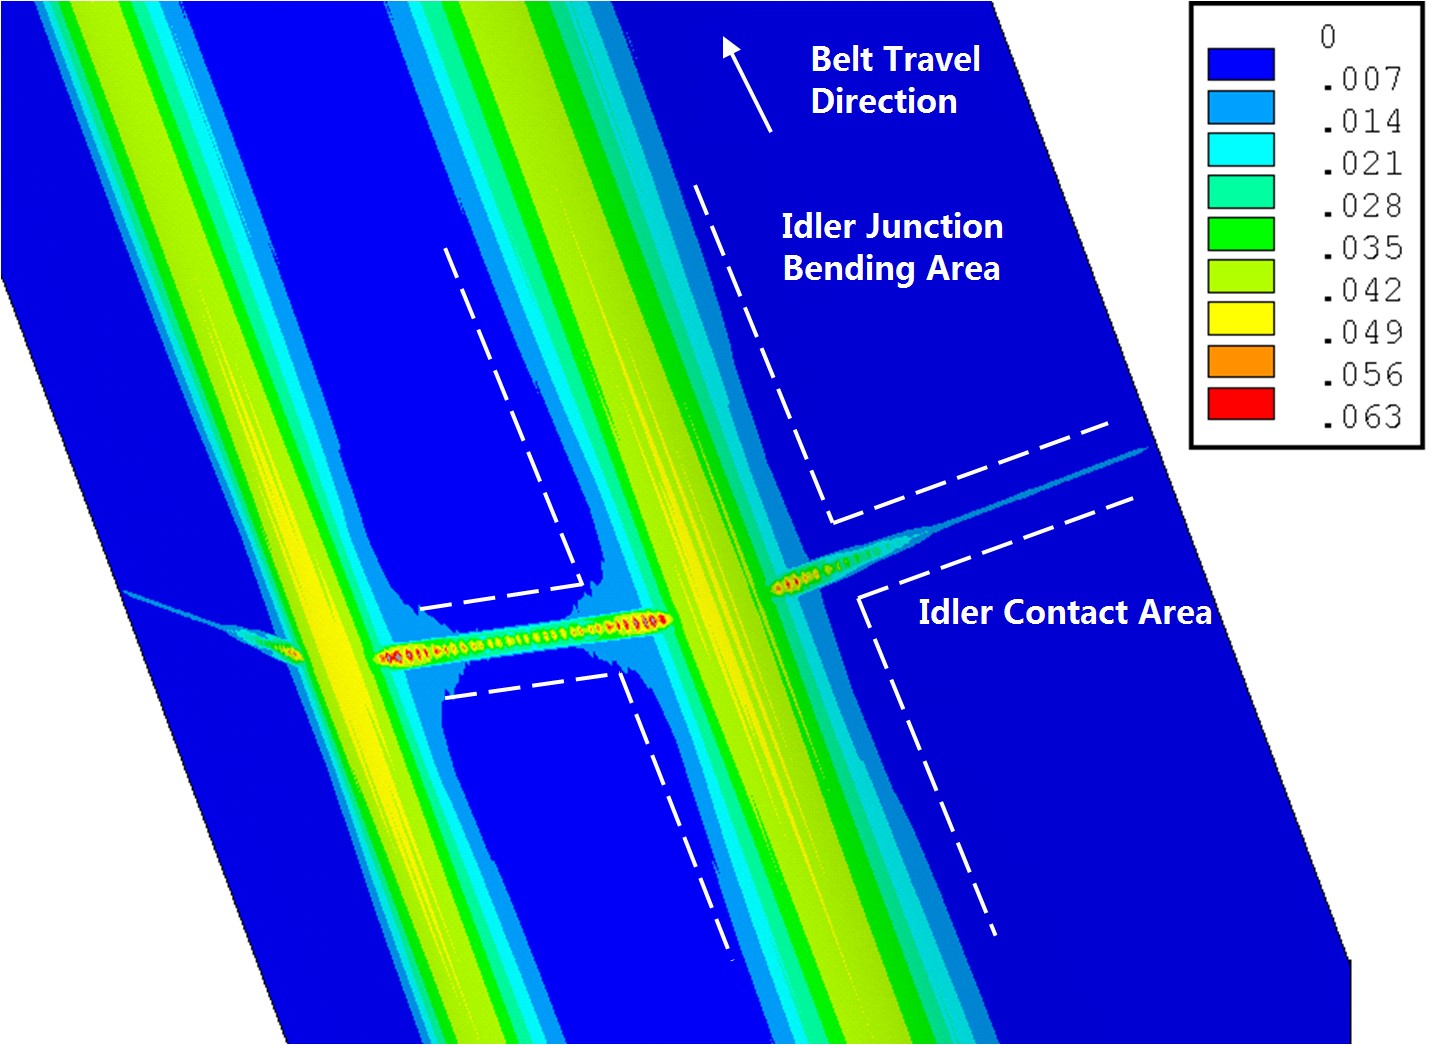
Beltstat software provides highly detailed belt analysis for system engineering. Includes analysis of vertical curves, horizontal curves, flat rotation, belt transitions, belt flapping (vibration) and pressure index on the rollers. Roller pressure index calculation is also a proprietary technology. In addition, we developed special finite element models to analyze unique cases and gain a deeper insight into the behavior of the channel belt.
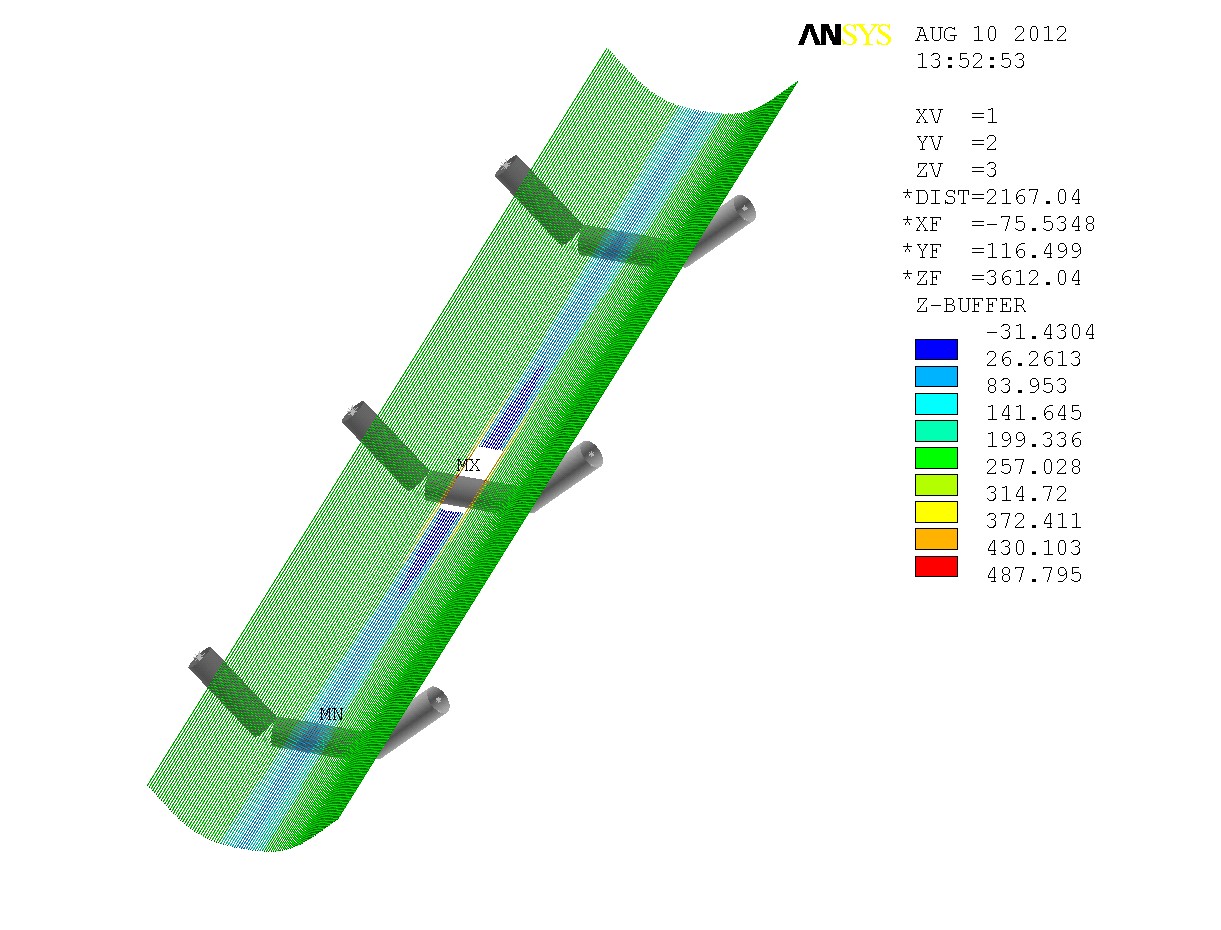
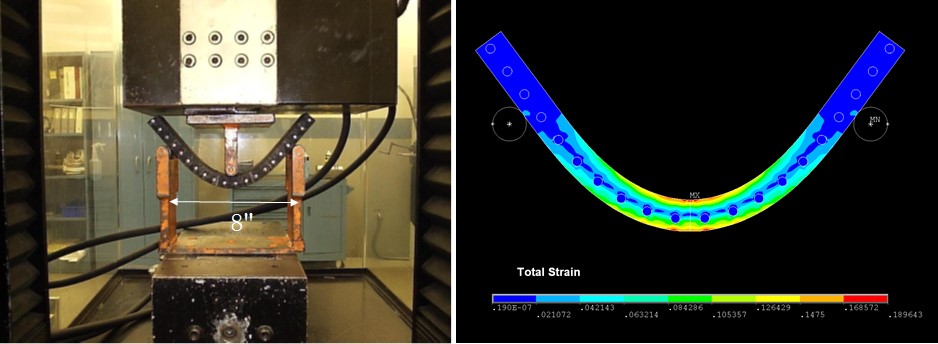
The following figure shows the FEA of a belt. The pressure between rollers refers to the area of the belt located between the central roller and the lateral roller. If the flex is too severe, the rubber on the bottom cover may fail.
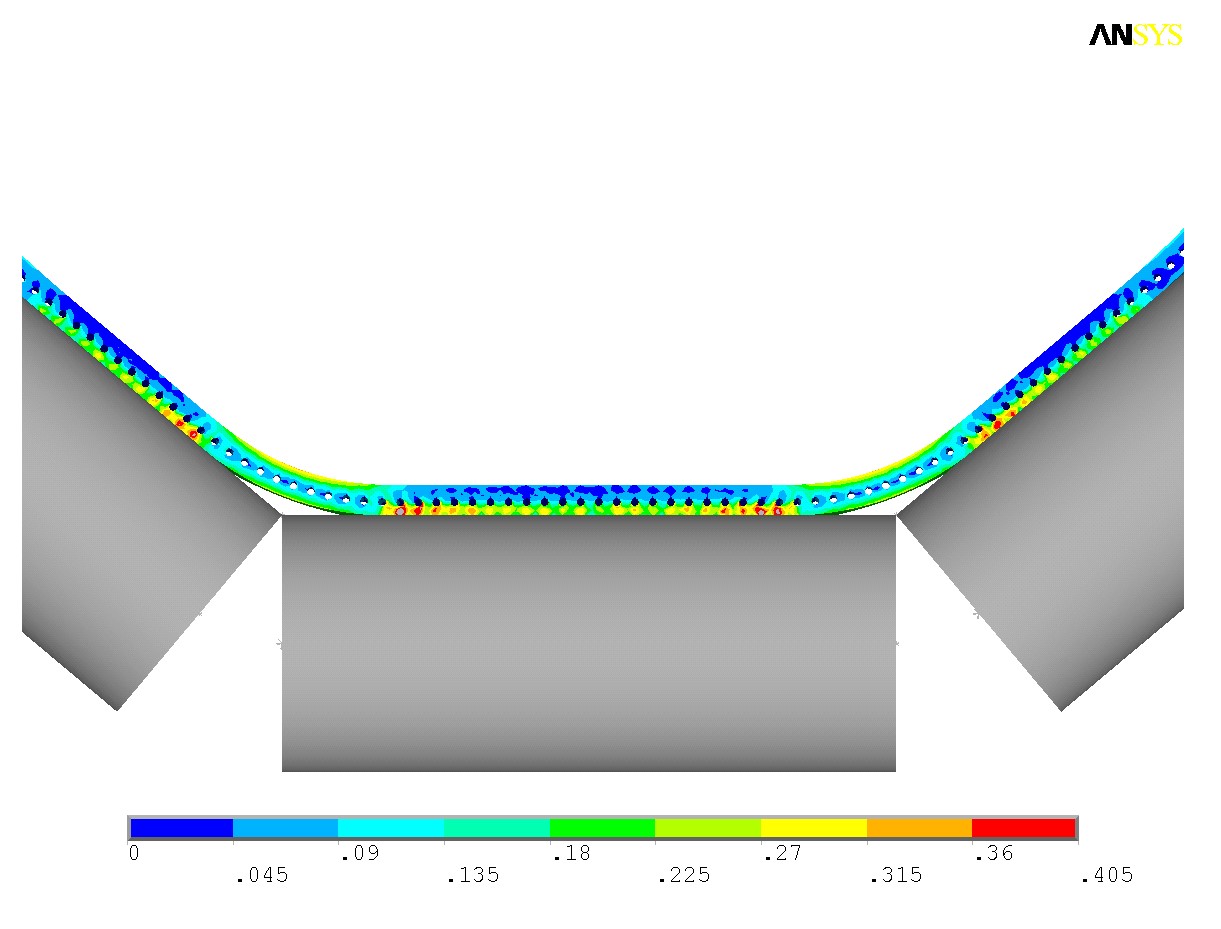
Tension in conveyor cross section through finite element analysis
The FEA can also simulate the behavior of the channel belt in the horizontal bend, especially when there is a special freewheel arrangement (5 rollers or deep channel), a small horizontal bend radius or a special band.
Tubular Belt
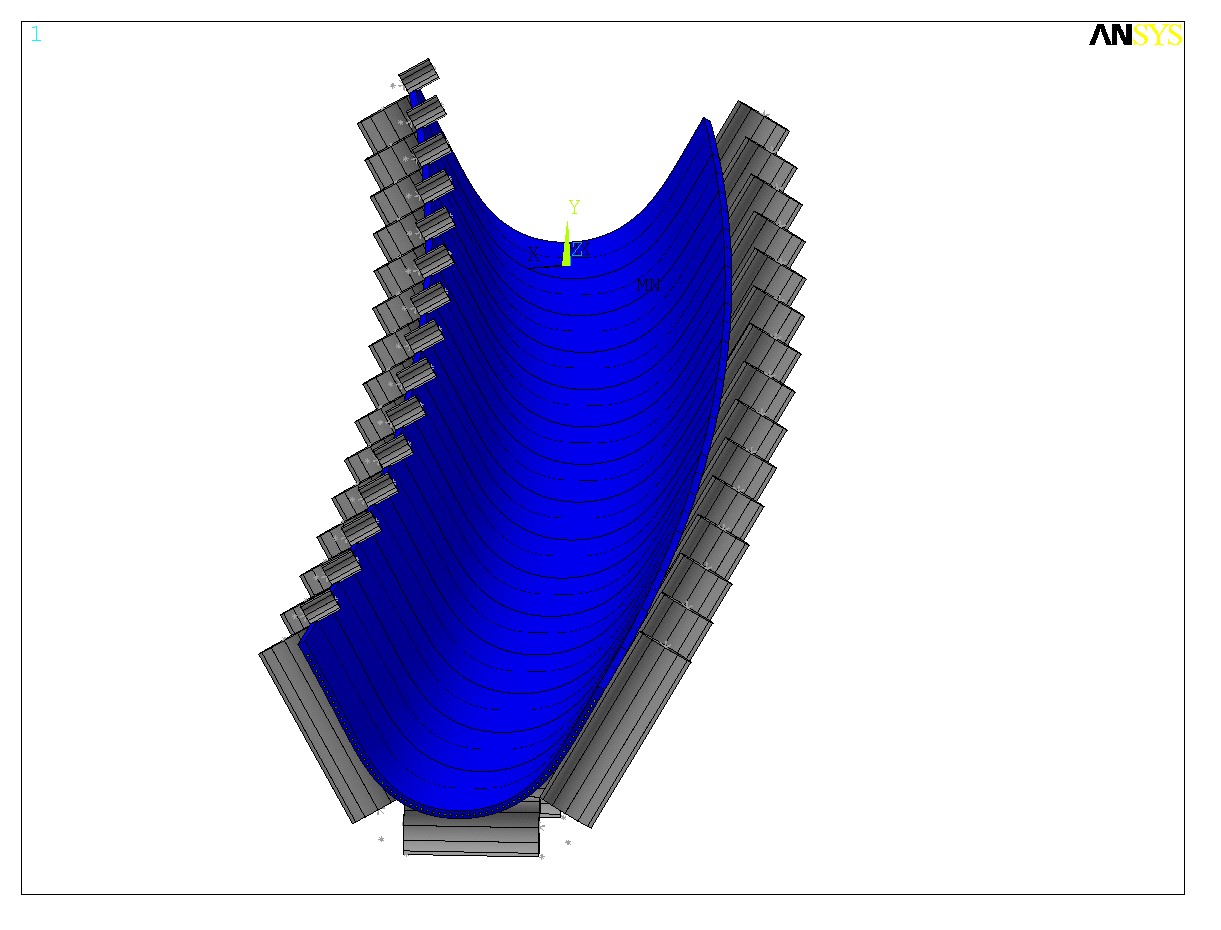
The tubular conveyor belt has a much greater influence on the performance of the conveyor system than a standard belt. The main factor is the stiffness of the tubular belt, as the belt is wound into a tube from the flat shape, the inherent flexural stiffness of the belt becomes the contact pressure on the surrounding rollers. Greater stiffness of the belt will result in higher contact pressure. This gives the tubular belt greater stability, better resistance to twisting and collapse during horizontal and vertical bends. But the penalty is increased power consumption, increased belt tension, and the need for a stronger belt and larger transmission size. From a design point of view, there is a balance in the stiffness of the belt to achieve for each individual project. If the path of the conveyor is straight, there is no need to design a tubular belt with high rigidity. Lower energy consumption and capital cost can be achieved. If the conveyor route has many bends with small radii, the stiffness of the belt should be increased accordingly to accommodate the bending effect of the bends so that the belt does not have excessive rotation, torsion and collapse.
CDI uses the three-point flex test to measure the stiffness of the pipe belt and calibrate the material properties in the finite element model of the tube belt. Three-point flexing is a well-defined flex test. Compared to the six-point stiffness test, it is much easier to make test samples and generate a design database. Once good numerical and experimental correlations are established between the three-point bending stiffness and the six-point pipe belt stiffness, there is no need to make full-width belt samples and go through a trial and error process for each design before actual production of the belt.
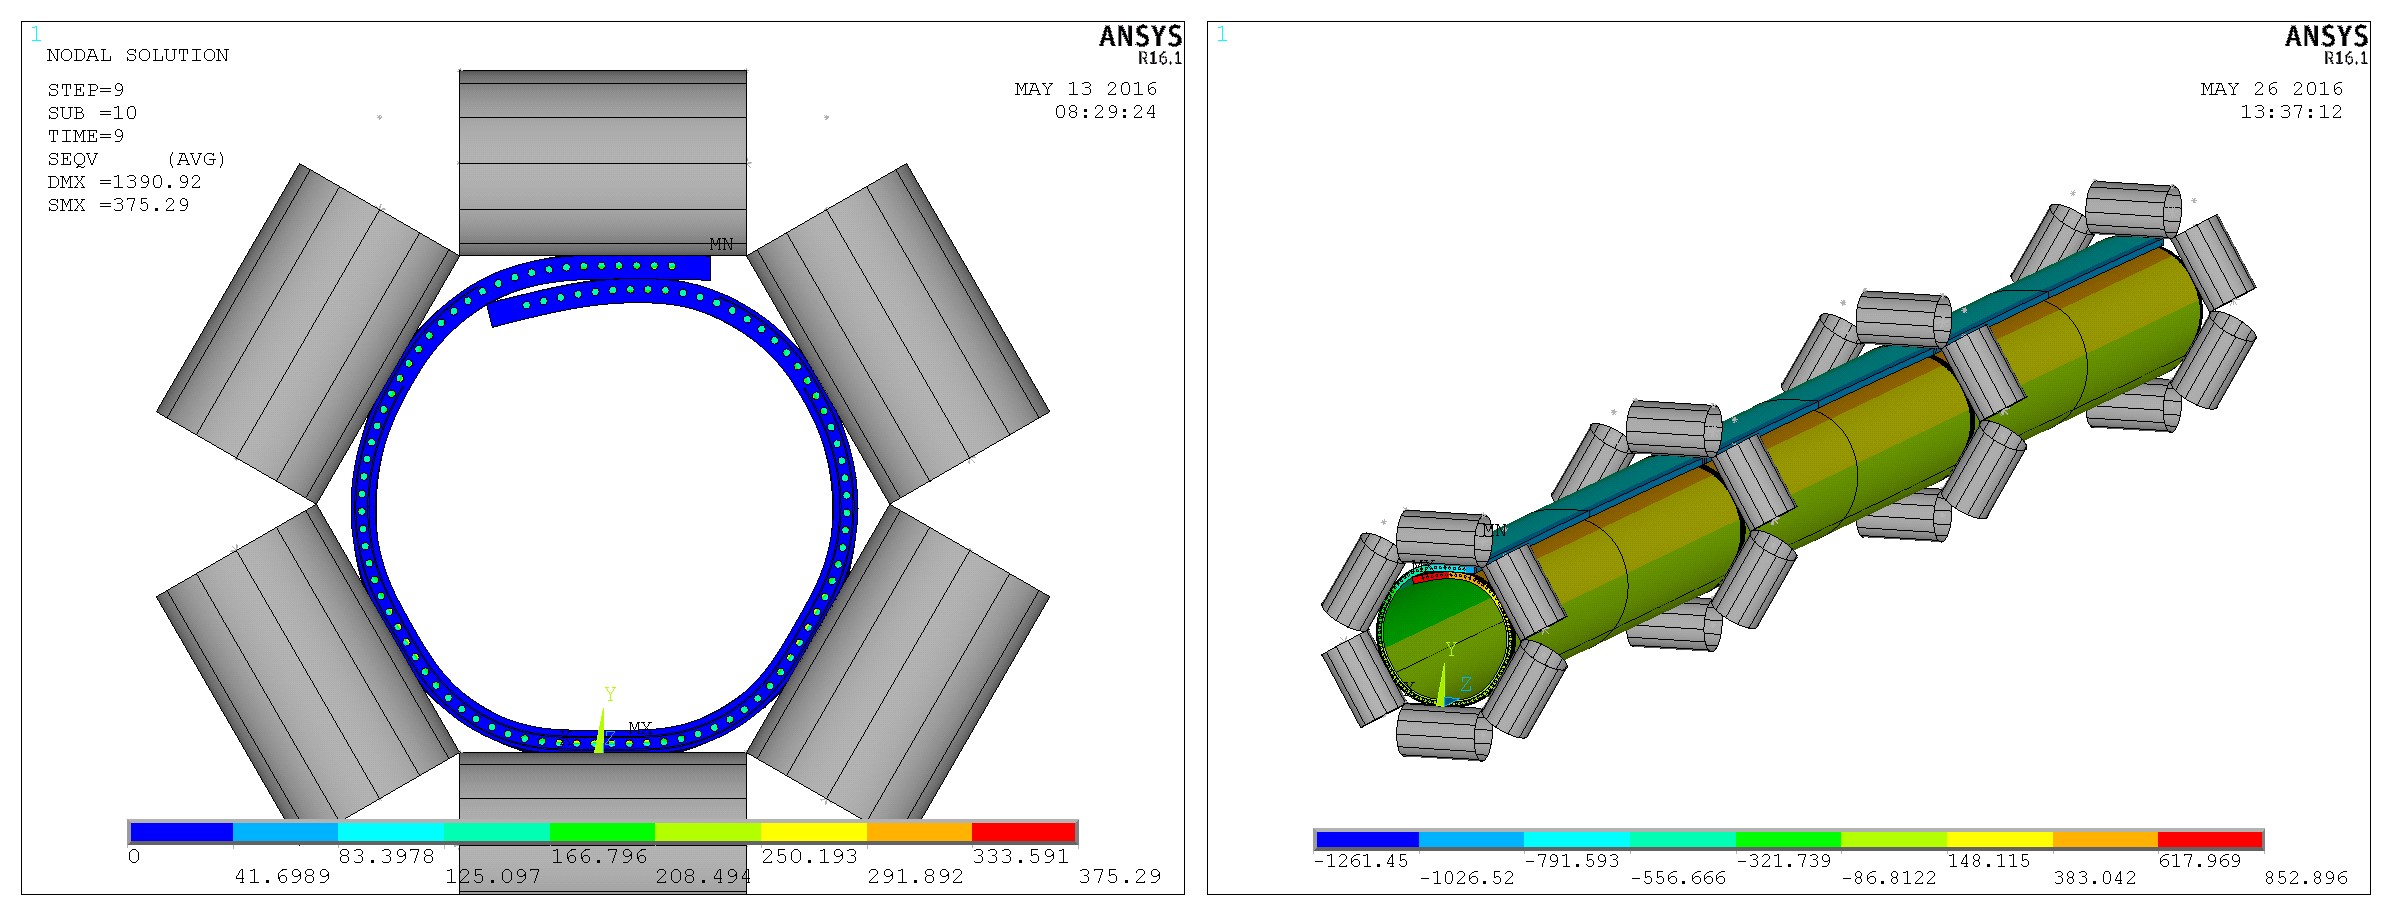
Unlike other published FEAs, where simplified casing or solid elements are used to represent both rubber, steel cord, and fabric materials, CDI uses a full 3D tubular belt model where layers of rubber, wire rope, and fabric are they model individually with their own material properties. The overall flex behavior of the tubular belt in FEA is compared and calibrated with three-point and six-point flexural stiffness test results. From finite element mode, contact pressure can be obtained on six surrounding rollers. By combining the results of the rubber rheology test and the contact pressure, the IRR of the tube belt can be calculated for each belt and conveyor. This is a more fundamental approach than empirical methods based on a predefined DIN friction factor. This allows the optimization of the tubular belt by using LRR and special belts such as heat resistant EPDM tubular belts.
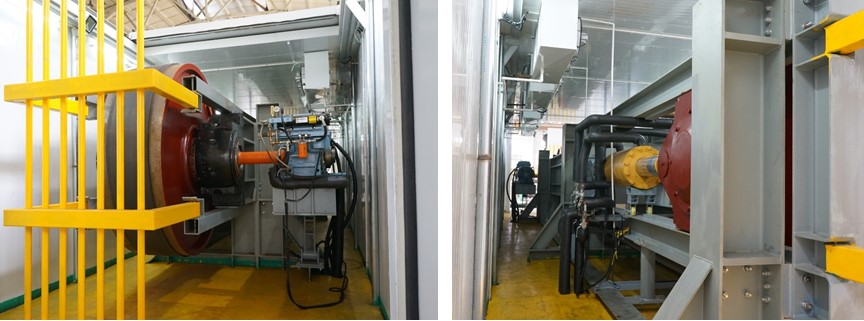
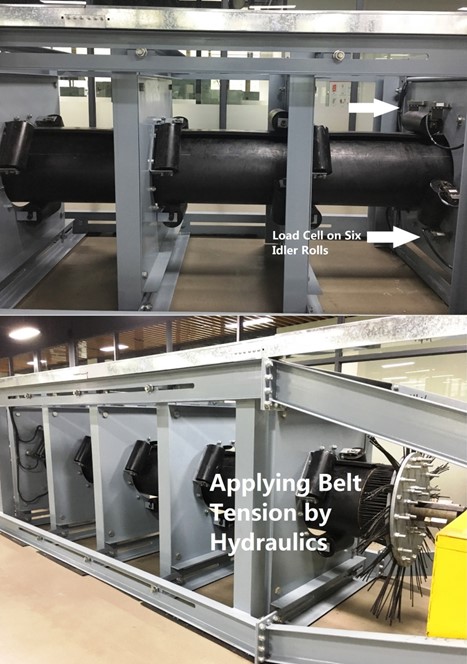
CDI designed a large-scale tubular belt testing machine. The testing machine is 11.4m long, it can accommodate pipe diameters from 200mm to 800mm. It has a hydraulic cylinder at one end to apply tension to the test belt. The intermediate panels can adjust the position to simulate horizontal and vertical curves. There is a panel where the load cells are attached to six idler rollers to measure the contact forces. The project is a collaboration with Double Arrow Rubber Co., Ltd., where the testing machine is located.
Broken Steel Cables
The problem of broken steel cables on the conveyor belt is complicated. There are many variables to consider, for example, the number of broken wires, the location of the broken wires, the different angles of the belt, the transition, etc. The conventional rule of thumb for broken steel cables on the conveyor belt is that if there are less than 5% broken cables at the edge of the belt and 10% broken cables in the center of the belt, the belt can be repaired without splicing again. If the number of broken wires exceeds this limit, the belt must be re-spliced. The typical repair fills the puncture region of the belt with rubber. Steel wire sections can also be inserted into the puncture region. However, the repair does not restore the loss of tension carrying capacity of the broken steel cables in the belt. It simply prevents material from spilling through the perforated region. CDI developed a program to study broken cables on conveyor belts. It is a tool to advise conveyor operators if they need to repair, re-splice or run the conveyor at lower capacity to maintain the safety factor of the belt. It is also used for failure analysis where broken cables on the conveyor lead to a sudden break in the belt.